U.S. Catholics: Key Data from Pew Research
Pew Research Center
Pope Benedict XVI is scheduled to hold his final general audience in St. Peter’s Square on Feb. 27, the day before he steps down as leader of the Roman Catholic Church. In the coming weeks, approximately 117 cardinals, including 11 from the United States, will gather to elect his successor. How do U.S. Catholics view the church, and what do they want from the next pope? Here are some of the Pew Research Center’s key findings about the U.S. Catholic population on these and other questions. POPULATION
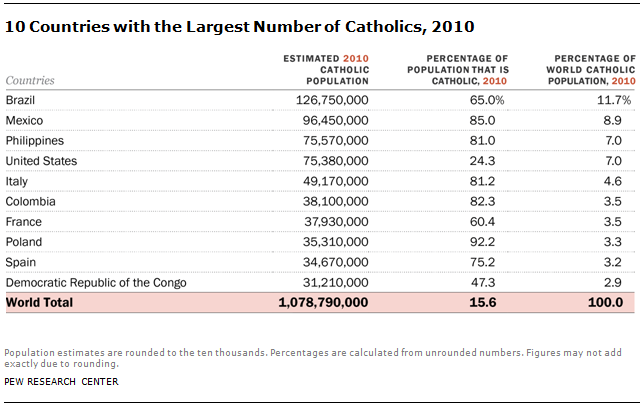
There are about 75 million Catholics in the United States, making up 7% of all Catholics in the world. The U.S. has the world’s fourth largest Catholic population numerically, behind Brazil, Mexico and the Philippines. How is the U.S. Catholic population changing? While the proportion of the U.S. population that is Catholic – around a quarter – has remained fairly steady for several decades, there have been some striking demographic shifts. For example, the U.S. Catholic population has been heavily shaped by immigration and includes a rising share of Latinos. This is evident in the age structure of the U.S. Catholic population, in which nearly half of Catholics under age 40 are Hispanic (47%), compared with about one-in-six (16%) Catholics 65 and older. How many American Catholics say they regularly attend Mass? Four-in-ten U.S. Catholics (41%) say they attend worship services at least once a week. The same percentage (41%) attends monthly or a few times a year, while 17% seldom or never attend. What do U.S. Catholics want from the next pope? American Catholics overall are split on whether the next pope should maintain the traditional positions of the church or move it in new directions. Two-thirds of those who attend Mass at least once a week prefer that the pope maintain traditional positions, while half of those who attend less frequently favor moving the church in new directions. A majority of U.S. Catholics think it would be good for the next pope to allow priests to marry. Catholics who attend Mass at least once a week are split on whether allowing priests to marry would be a good thing or a bad thing, but two-thirds of those who attend less often say it would be a good thing. A majority of U.S. Catholics also think it would be good if the next pope hailed from a developing region of the world. This opinion holds among both frequent and infrequent Mass attenders. How do U.S. Catholics view Pope Benedict XVI? Currently, about three-quarters of U.S. Catholics express a favorable opinion of Pope Benedict XVI. Benedict’s ratings among Catholics now stand about where they were in March 2008 (just before his U.S. visit) and are lower than they were in April 2008, when 83% of U.S. Catholics expressed favorable views of him. Pope John Paul II was consistently rated favorably by upwards of 90% of U.S. Catholics. About half of U.S. Catholics (55%) say Benedict has done a good or excellent job at promoting relations with other religions. The evaluation of his handling of the sex abuse scandal is less positive; about two-thirds call his efforts “only fair” or poor, while one-third calls them excellent or good. How do American Catholics view their other leaders? Seven-in-ten U.S. Catholics say they are satisfied with the leadership of the American bishops, and about eight-in-ten say they are satisfied with their parish priest and American nuns. How big is the Catholic share of the U.S. electorate? In the 2012 presidential election, Catholics made up a quarter of the total electorate, which was little changed from the last few presidential election years. How did Catholics vote in the last U.S. election? Catholics were evenly divided in their vote choice in 2012, with 50% voting for Barack Obama and 48% for Mitt Romney. Roughly six-in-ten white Catholics, however, voted for Romney, while most Hispanic Catholics voted for Obama. Have Catholics’ political party preferences changed in recent years? While Democrats held an advantage among white non-Hispanic Catholic voters in 2008, from 2010 through 2012 the balance was reversed. As of 2012, 50% of white Catholic voters identify with or lean toward the Republican Party, and 41% identify with or lean toward the Democrats. By contrast, 63% of Hispanic Catholics identify with or lean toward the Democratic Party as of 2012, and 28% identify with or lean toward the Republicans. How do U.S. Catholics view same-sex marriage? As of 2012, about half of U.S. Catholics support same-sex marriage. This level of support has increased over the past decade, rising from 40% in favor in 2001. How do U.S. Catholics view abortion? Half of U.S. Catholics overall (51%) say that abortion should be legal in all or most cases, while 44% say it should be illegal in all or most cases. Among white Catholics, 54% say abortion should be legal in all or most cases. By contrast, among Hispanic Catholics, 53% say abortion should be illegal in all or most cases. In the general public, 54% say abortion should be legal in all or most cases, while 39% say it should be illegal in all or most cases. How do U.S. Catholics view contraception? Just 15% of U.S. Catholics say that using contraceptives is morally wrong. Greater percentages say contraception is either morally acceptable (41%) or not a moral issue (36%). Catholics who attend Mass at least once a week are more evenly split. About three-in-ten say using contraceptives is morally wrong (27%). Similar percentages say it is morally acceptable (33%) or not a moral issue (30%). How do U.S. Catholics view the death penalty? Like most religious groups, a majority of U.S. Catholics (59%) stand in favor of the death penalty for those convicted of murder. About one-third of Catholics are opposed to the death penalty. How do U.S. Catholics view the size of government? Overall, American Catholics are split on the role of government; 48% prefer a smaller government with fewer services, while 42% prefer a bigger government with more services.
|


.
Any original material on these pages is copyright © BishopAccountability.org 2004. Reproduce freely with attribution.