|
Pope Francis’ Image Positive in Much of World
Pew Research
December 11, 2014
http://www.pewglobal.org/2014/12/11/pope-francis-image-positive-in-much-of-world/
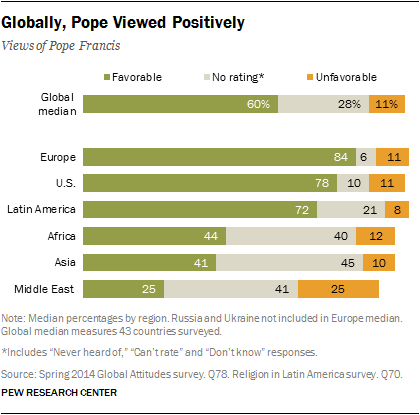
Pope Francis, leader of the world’s nearly 1.1 billion Catholics, enjoys broad support across much of the world, according to a new survey report by the Pew Research Center.
Francis’ Latin America – the pope’s home region – also gives him high marks, with 72% saying they have a positive opinion. However, Francis is less well-known in other parts of the world. In Africa, 44% say they like the pope, but 40% offer no rating. Asians are similarly unfamiliar with Francis, with 41% supporting him and 45% expressing no opinion. However, an equal number (25%) give a positive rating and a plurality (41%) do not rate him.
Americans
These are among the key findings from two surveys by the Pew Research Center, one conducted from October 30, 2013 to March 4, 2014, among 14,564 respondents in nine Latin American countries, and another from March 17 to June 5, 2014, among 36,430 respondents in 34 countries.
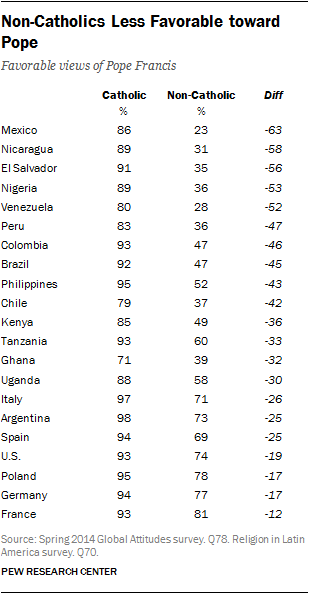
Catholics Big Fans of Pope Francis
And, in all of these countries, Catholics express more support for the pope than non-Catholics.
It is worth noting that these gaps in favorability do not necessarily mean that non-Catholics view Francis unfavorably. In fact, in most countries with sizable differences, non-Catholics are more likely to have no set opinion of the pope than a negative one.
The biggest differences among favorable views of Francis appear in Latin American countries. While the pope receives extremely positive marks from Catholics throughout the region, wide gaps exist between Catholics and non-Catholics in Mexico (-63 percentage points), Nicaragua (-58), El Salvador (-56), Venezuela (-52), Peru (-47), Colombia (-46) and Brazil (-45). However, non-Catholics in these countries generally give no rating for Pope Francis, rather than say they do not like him.
In the U.S. and Europe, the favorability gap is less substantial. Spain (-25), the U.S. (-19), Poland (-17), Germany (-17) and France (-12) show smaller differences in support for the pope across the denominational divide. Both Catholics and non-Catholics in all of these countries overwhelmingly voice favorable attitudes towards Francis.
A Popular Pope
Majorities or pluralities of the general public in 28 of the 43 countries surveyed say they have a positive view of Pope Francis. Europe and Latin America give the pope particularly high ratings – majorities in almost every country in these two regions view the pope favorably.
In including 65% with a very favorable view. Majorities in every other Latin American country also see the pope in a positive light, including seven-in-ten or more in Colombia (83%), Mexico (74%), Brazil (74%) and Peru (72%).
Eight-in-ten or more also express support for the pope in Poland (92%), Italy (91%), France (88%), Spain (84%) and Germany (82%). A smaller portion, yet still a majority, in the United Kingdom (65%) view Francis favorably. Roughly half the Greeks (49%) agree, though nearly a quarter (24%) have an unfavorable view and about three-in-ten (28%) do not rate him.
His favorability is lower in other regions, though many say they cannot rate him, have never heard of him or do not have an opinion. In Asia, broad majorities in the Philippines (88%) and South Korea (86%) express positive views of Francis. At least four-in-ten give favorable views in Thailand (49%), Bangladesh (47%), Vietnam (41%) and Japan (40%). But majorities in Indonesia (57%), India (61%), Malaysia (76%) and Pakistan (85%) do not have an opinion of the pope at all.
A similar pattern arises in Africa. Majorities in Uganda (70%), Tanzania (70%) and Kenya (56%) – countries with the highest percentages of Catholics in the African nations surveyed – give the pope a favorable rating. However, four-in-ten or more in Ghana (40%), Nigeria (46%), South Africa (52%) and Senegal (55%), where more people tend to be Protestant or Muslim, offer no opinion.
Many in the Middle East do not offer a rating of the pope. But of those who have an opinion, there are interesting differences between countries. Francis is most popular in Lebanon (62% favorable), where more than a quarter of the population is Catholic. And half in Israel give the pope favorable marks. (Pope Francis visited Israel and the Palestinian territories about two weeks after the survey was conducted.) However, the pope receives his most negative ratings in Egypt (35% unfavorable), Jordan (34%) and Turkey (32%). Like many other countries with small Catholic populations, the pope is relatively unknown in Tunisia (71% no rating) and the Palestinian territories (63%).
Methods in Detail
About the 2014 Spring Pew Global Attitudes Survey
Results for the survey are based on telephone and face-to-face interviews conducted under the direction of Princeton Survey Research Associates International. Survey results are based on national samples. For more information about methodology in Latin American countries, see the Pew Research Religion & Public Life Project’s report, “Religion in Latin America,” released on November 13, 2014. For further details on sample designs, see below.
The descriptions below show the margin of sampling error based on all interviews conducted in that country. For results based on the full sample in a given country, one can say with 95% confidence that the error attributable to sampling and other random effects is plus or minus the margin of error. In addition to sampling error, one should bear in mind that question wording and practical difficulties in conducting surveys can introduce error or bias into the findings of opinion polls.
|
Country: |
Argentina |
|
Sample design: |
Multi-stage cluster sample stratified by region, locality size and socioeconomic status |
|
Mode: |
Face-to-face adults 18 plus |
|
Languages: |
Spanish |
|
Fieldwork dates: |
November 15, 2013 – January 8, 2014 |
|
Sample size: |
1,512 |
|
Margin of error: |
+/-3.9 percentage points |
|
Representative: |
Nationally representative of 99% of the adult population (excluding Tierra
del Fuego, inaccessible or sparsely populated areas, and villages with fewer
than 400 people) |
|
|
|
Country: |
Bangladesh |
|
Sample design: |
Multi-stage cluster sample stratified by administrative division and urbanity |
|
Mode: |
Face-to-face adults 18 plus |
|
Languages: |
Bengali |
|
Fieldwork dates: |
April 14 – May 11, 2014 |
|
Sample size: |
1,000 |
|
Margin of error: |
+/-3.8 percentage points |
|
Representative: |
Adult population |
|
|
|
Country: |
Brazil |
|
Sample design: |
Multi-stage cluster sample stratified by region, municipality size and socioeconomic status |
|
Mode: |
Face-to-face adults 18 plus |
|
Languages: |
Portuguese |
|
Fieldwork dates: |
November 4, 2013 – February 14, 2014 |
|
Sample size: |
2,000 |
|
Margin of error: |
+/-3.8 percentage points |
|
Representative: |
Nationally representative of 97% of the adult population (excluding remote areas in the Amazon rainforest and interior parts of the Amazonian states) |
|
|
|
Country: |
Chile |
|
Sample design: |
Multi-stage cluster sample stratified by provinces/major cities, urbanity and socioeconomic status |
|
Mode: |
Face-to-face adults 18 plus |
|
Languages: |
Spanish |
|
Fieldwork dates: |
November 11 – December 16, 2013 |
|
Sample size: |
1,504 |
|
Margin of error: |
+/-3.6 percentage points |
|
Representative: |
Nationally representative of 99% of the adult population (excluding remote areas in the Atacama Desert, in mountainous areas, on islands and in the far South) |
|
|
|
Country: |
Colombia |
|
Sample design: |
Multi-stage cluster sample stratified by municipality and department size |
|
Mode: |
Face-to-face adults 18 plus |
|
Languages: |
Spanish |
|
Fieldwork dates: |
November 28, 2013 – March 4, 2014 |
|
Sample size: |
1,508 |
|
Margin of error: |
+/-3.8 percentage points |
|
Representative: |
Nationally representative of 97% of the adult population (excluding remote areas in the Amazon rain forest and San Andres Island) |
|
|
|
Country: |
Egypt |
|
Sample design: |
Multi-stage cluster sample stratified by governorate and urbanity |
|
Mode: |
Face-to-face adults 18 plus |
|
Languages: |
Arabic |
|
Fieldwork dates: |
April 10 – April 29, 2014 |
|
Sample size: |
1,000 |
|
Margin of error: |
+/-4.3 percentage points |
|
Representative: |
Adult population (excluding frontier governorates, or about 2% of the population) |
|
|
|
Country: |
El Salvador |
|
Sample design: |
Multi-stage cluster sample stratified by department and urbanity |
|
Mode: |
Face-to-face adults 18 plus |
|
Languages: |
Spanish |
|
Fieldwork dates: |
November 9 – December 17, 2013 |
|
Sample size: |
1,500 |
|
Margin of error: |
+/-3.7 percentage points |
|
Representative: |
Adult population |
|
|
|
Country: |
France |
|
Sample design: |
Random Digit Dial (RDD) sample of landline and cell phone households with quotas for gender, age and occupation and stratified by region and urbanity |
|
Mode: |
Telephone adults 18 plus |
|
Languages: |
French |
|
Fieldwork dates: |
March 17 – April 1, 2014 |
|
Sample size: |
1,003 |
|
Margin of error: |
+/-4.1 percentage points |
|
Representative: |
Telephone households (roughly 99% of all French households) |
|
|
|
Country: |
Germany |
|
Sample design: |
Random Digit Dial (RL(2)D) probability sample of landline households, stratified by administrative district and community size, and cell phone households |
|
Mode: |
Telephone adults 18 plus |
|
Languages: |
German |
|
Fieldwork dates: |
March 17 – April 2, 2014 |
|
Sample size: |
1,000 |
|
Margin of error: |
+/-4.0 percentage points |
|
Representative: |
Telephone households (roughly 99% of all German households) |
|
|
|
Country: |
Ghana |
|
Sample design: |
Multi-stage cluster sample stratified by region and settlement size |
|
Mode: |
Face-to-face adults 18 plus |
|
Languages: |
Akan (Twi), English, Dagbani, Ewe |
|
Fieldwork dates: |
May 5 – May 31, 2014 |
|
Sample size: |
1,000 |
|
Margin of error: |
+/-3.8 percentage points |
|
Representative: |
Adult population |
|
|
|
Country: |
Greece |
|
Sample design: |
Multi-stage cluster sample stratified by region and urbanity |
|
Mode: |
Face-to-face adults 18 plus |
|
Languages: |
Greek |
|
Fieldwork dates: |
March 22 – April 9, 2014 |
|
Sample size: |
1,000 |
|
Margin of error: |
+/-3.7 percentage points |
|
Representative: |
Adult population (excluding the islands in the Aegean and Ionian Seas, or roughly 6% of the population) |
|
|
|
Country: |
India |
|
Sample design: |
Multi-stage cluster sample stratified by region and urbanity |
|
Mode: |
Face-to-face adults 18 plus |
|
Languages: |
Hindi, Bengali, Tamil, Telugu, Marathi, Kannada, Gujarati, Odia |
|
Fieldwork dates: |
April 14 – May 1, 2014 |
|
Sample size: |
2,464 |
|
Margin of error: |
+/-3.1 percentage points |
|
Representative: |
Adult population in 15 of the 17 most populous states (Kerala and Assam were excluded) and the Union Territory of Delhi (roughly 91% of the population). Disproportionately urban. The data were weighted to reflect the actual urbanity distribution in India. |
|
|
|
Country: |
Indonesia |
|
Sample design: |
Multi-stage cluster sample stratified by province and urbanity |
|
Mode: |
Face-to-face adults 18 plus |
|
Languages: |
Bahasa Indonesian |
|
Fieldwork dates: |
April 17 – May 23, 2014 |
|
Sample size: |
1,000 |
|
Margin of error: |
+/-4.0 percentage points |
|
Representative: |
Adult population (excluding Papua and remote areas or provinces with small populations, or 12% of the population) |
|
|
|
Country: |
Israel |
|
Sample design: |
Multi-stage cluster sample stratified by district, urbanity and socioeconomic status, with an oversample of Arabs |
|
Mode: |
Face-to-face adults 18 plus |
|
Languages: |
Hebrew, Arabic |
|
Fieldwork dates: |
April 24 – May 11, 2014 |
|
Sample size: |
1,000 (597 Jews, 388 Arabs, 15 others) |
|
Margin of error: |
+/-4.3 percentage points |
|
Representative: |
Adult population (The data were weighted to reflect the actual distribution of Jews, Arabs and others in Israel.) |
|
|
|
Country: |
Italy |
|
Sample design: |
Multi-stage cluster sample stratified by region and urbanity |
|
Mode: |
Face-to-face adults 18 plus |
|
Languages: |
Italian |
|
Fieldwork dates: |
March 18 – April 7, 2014 |
|
Sample size: |
1,000 |
|
Margin of error: |
+/-4.3 percentage points |
|
Representative: |
Adult population |
|
|
|
Country: |
Japan |
|
Sample design: |
Random Digit Dial (RDD) probability sample of landline households stratified by region and population size |
|
Mode: |
Telephone adults 18 plus |
|
Languages: |
Japanese |
|
Fieldwork dates: |
April 10 – April 27, 2014 |
|
Sample size: |
1,000 |
|
Margin of error: |
+/-3.2 percentage points |
|
Representative: |
Landline households (roughly 86% of all Japanese households) |
|
|
|
Country: |
Jordan |
|
Sample design: |
Multi-stage cluster sample stratified by governorate and urbanity |
|
Mode: |
Face-to-face adults 18 plus |
|
Languages: |
Arabic |
|
Fieldwork dates: |
April 11 – April 29, 2014 |
|
Sample size: |
1,000 |
|
Margin of error: |
+/-4.5 percentage points |
|
Representative: |
Adult population |
|
|
|
Country: |
Kenya |
|
Sample design: |
Multi-stage cluster sample stratified by province and settlement size |
|
Mode: |
Face-to-face adults 18 plus |
|
Languages: |
Kiswahili, English |
|
Fieldwork dates: |
April 18 – April 28, 2014 |
|
Sample size: |
1,015 |
|
Margin of error: |
+/-4.0 percentage points |
|
Representative: |
Adult population |
|
|
|
Country: |
Lebanon |
|
Sample design: |
Multi-stage cluster sample stratified by region and urbanity |
|
Mode: |
Face-to-face adults 18 plus |
|
Languages: |
Arabic |
|
Fieldwork dates: |
April 11 – May 2, 2014 |
|
Sample size: |
1,000 |
|
Margin of error: |
+/-4.1 percentage points |
|
Representative: |
Adult population (excluding a small area in Beirut controlled by a militia group and a few villages in the south of Lebanon, which border Israel and are inaccessible to outsiders, or about 2% of the population) |
|
|
|
Country: |
Malaysia |
|
Sample design: |
Multi-stage cluster sample stratified by state and urbanity |
|
Mode: |
Face-to-face adults 18 plus |
|
Languages: |
Bahasa Malaysia, Mandarin Chinese, English |
|
Fieldwork dates: |
April 10 – May 23, 2014 |
|
Sample size: |
1,010 |
|
Margin of error: |
+/-3.8 percentage points |
|
Representative: |
Adult population (excluding difficult to access areas in Sabah and Sarawak, or about 7% of the population) |
|
|
|
Country: |
Mexico |
|
Sample design: |
Multi-stage cluster sample stratified by region, urbanity and election results |
|
Mode: |
Face-to-face adults 18 plus |
|
Languages: |
Spanish |
|
Fieldwork dates: |
October 30 – November 12, 2013 |
|
Sample size: |
2,000 |
|
Margin of error: |
+/-3.7 percentage points |
|
Representative: |
Adult population |
|
Notes: |
The sample for Mexico includes a base sample of 1,500 interviews, plus an oversample of 500 interviews in the southern states of Chiapas, Tabasco, Campeche and Quintana Roo. |
|
|
|
Country: |
Nicaragua |
|
Sample design: |
Multi-stage cluster sample stratified by department and urbanity |
|
Mode: |
Face-to-face adults 18 plus |
|
Languages: |
Spanish |
|
Fieldwork dates: |
November 9 – December 13, 2013 |
|
Sample size: |
1,500 |
|
Margin of error: |
+/-2.8 percentage points |
|
Representative: |
Nationally representative of 99% of the adult population (excluding residents of gated communities and multi-story residential buildings) |
|
|
|
Country: |
Nigeria |
|
Sample design: |
Multi-stage cluster sample stratified by region and urbanity |
|
Mode: |
Face-to-face adults 18 plus |
|
Languages: |
English, Hausa, Yoruba, Igbo |
|
Fieldwork dates: |
April 11 – May 25, 2014 |
|
Sample size: |
1,014 |
|
Margin of error: |
+/-4.3 percentage points |
|
Representative: |
Adult population (excluding Adamawa, Borno, Cross River, Jigawa, Yobe, and some areas in Taraba, or roughly 12% of the population) |
|
|
|
Country: |
Pakistan |
|
Sample design: |
Multi-stage cluster sample stratified by province and urbanity |
|
Mode: |
Face-to-face adults 18 plus |
|
Languages: |
Urdu, Pashto, Punjabi, Saraiki, Sindhi |
|
Fieldwork dates: |
April 15 – May 7, 2014 |
|
Sample size: |
1,203 |
|
Margin of error: |
+/-4.2 percentage points |
|
Representative: |
Adult population (excluding the Federally Administered Tribal Areas, Gilgit-Baltistan, Azad Jammu and Kashmir for security reasons, areas of instability in Khyber Pakhtunkhwa [formerly the North-West Frontier Province] and Baluchistan, military restricted areas and villages with less than 100 inhabitants – together, roughly 18% of the population). Disproportionately urban. The data were weighted to reflect the actual urbanity distribution in Pakistan. |
|
|
|
Country: |
Palestinian territories |
|
Sample design: |
Multi-stage cluster sample stratified by region and urban/rural/refugee camp population |
|
Mode: |
Face-to-face adults 18 plus |
|
Languages: |
Arabic |
|
Fieldwork dates: |
April 15 – April 22, 2014 |
|
Sample size: |
1,000 |
|
Margin of error: |
+/-4.4 percentage points |
|
Representative: |
Adult population (excluding Bedouins who regularly change residence and some communities near Israeli settlements where military restrictions make access difficult, or roughly 5% of the population) |
|
|
|
Country: |
Peru |
|
Sample design: |
Multi-stage cluster sample stratified by region, locality size and urbanity |
|
Mode: |
Face-to-face adults 18 plus |
|
Languages: |
Spanish |
|
Fieldwork dates: |
November 13 – December 16, 2013 |
|
Sample size: |
1,500 |
|
Margin of error: |
+/-4.0 percentage points |
|
Representative: |
Nationally representative of 99% of the adult population |
|
|
|
Country: |
Philippines |
|
Sample design: |
Multi-stage cluster sample stratified by region and urbanity |
|
Mode: |
Face-to-face adults 18 plus |
|
Languages: |
Tagalog, Cebuano, Ilonggo, Ilocano, Bicolano |
|
Fieldwork dates: |
May 1 – May 21, 2014 |
|
Sample size: |
1,008 |
|
Margin of error: |
+/-4.0 percentage points |
|
Representative: |
Adult population |
|
|
|
Country: |
Poland |
|
Sample design: |
Multi-stage cluster sample stratified by province and urbanity |
|
Mode: |
Face-to-face adults 18 plus |
|
Languages: |
Polish |
|
Fieldwork dates: |
March 17 – April 8, 2014 |
|
Sample size: |
1,010 |
|
Margin of error: |
+/-3.6 percentage points |
|
Representative: |
Adult population |
|
|
|
Country: |
Russia |
|
Sample design: |
Multi-stage cluster sample stratified by Russia’s eight geographic regions, plus the cities of Moscow and St. Petersburg, and by urban-rural status |
|
Mode: |
Face-to-face adults 18 plus |
|
Languages: |
Russian |
|
Fieldwork dates: |
April 4 – April 20, 2014 |
|
Sample size: |
1,000 |
|
Margin of error: |
+/-3.6 percentage points |
|
Representative: |
Adult population (excludes Chechen Republic, Ingush Republic and remote territories in the Far North – together, roughly 3% of the population) |
|
|
|
Country: |
Senegal |
|
Sample design: |
Multi-stage cluster sample stratified by region and urbanity |
|
Mode: |
Face-to-face adults 18 plus |
|
Languages: |
Wolof, French |
|
Fieldwork dates: |
April 17 – May 2, 2014 |
|
Sample size: |
1,000 |
|
Margin of error: |
+/-3.7 percentage points |
|
Representative: |
Adult population |
|
|
|
Country: |
South Africa |
|
Sample design: |
Multi-stage cluster sample stratified by metropolitan area, province and urbanity |
|
Mode: |
Face-to-face adults 18 plus |
|
Languages: |
English, Zulu, Xhosa, South Sotho, Afrikaans, North Sotho |
|
Fieldwork dates: |
May 18 – June 5, 2014 |
|
Sample size: |
1,000 |
|
Margin of error: |
+/-3.5 percentage points |
|
Representative: |
Adult population |
|
|
|
Country: |
South Korea |
|
Sample design: |
Random Digit Dial (RDD) probability sample of adults who own a cell phone |
|
Mode: |
Telephone adults 18 plus |
|
Languages: |
Korean |
|
Fieldwork dates: |
April 17 – April 30, 2014 |
|
Sample size: |
1,009 |
|
Margin of error: |
+/-3.2 percentage points |
|
Representative: |
Adults who own a cell phone (roughly 96% of adults age 18 and older) |
|
|
|
Country: |
Spain |
|
Sample design: |
Random Digit Dial (RDD) probability sample of landline and cell phone-only households stratified by region |
|
Mode: |
Telephone adults 18 plus |
|
Languages: |
Spanish/Castilian |
|
Fieldwork dates: |
March 17 – March 31, 2014 |
|
Sample size: |
1,009 |
|
Margin of error: |
+/-3.2 percentage points |
|
Representative: |
Telephone households (roughly 97% of Spanish households) |
|
|
|
Country: |
Tanzania |
|
Sample design: |
Multi-stage cluster sample stratified by region and urbanity |
|
Mode: |
Face-to-face adults 18 plus |
|
Languages: |
Kiswahili |
|
Fieldwork dates: |
April 18 – May 7, 2014 |
|
Sample size: |
1,016 |
|
Margin of error: |
+/-4.0 percentage points |
|
Representative: |
Adult population (excluding Zanzibar, or about 3% of the population) |
|
|
|
Country: |
Thailand |
|
Sample design: |
Multi-stage cluster sample stratified by region and urbanity |
|
Mode: |
Face-to-face adults 18 plus |
|
Languages: |
Thai |
|
Fieldwork dates: |
April 23 – May 24, 2014 |
|
Sample size: |
1,000 |
|
Margin of error: |
+/-3.9 percentage points |
|
Representative: |
Adult population (excluding the provinces of Narathiwat, Pattani, and Yala, or about 3% of the population) |
|
|
|
Country: |
Tunisia |
|
Sample design: |
Multi-stage cluster sample stratified by governorate and urbanity |
|
Mode: |
Face-to-face adults 18 plus |
|
Languages: |
Tunisian Arabic |
|
Fieldwork dates: |
April 19 – May 9, 2014 |
|
Sample size: |
1,000 |
|
Margin of error: |
+/-4.0 percentage points |
|
Representative: |
Adult population |
|
|
|
Country: |
Turkey |
|
Sample design: |
Multi-stage cluster sample stratified by region, urbanity and settlement size |
|
Mode: |
Face-to-face adults 18 plus |
|
Languages: |
Turkish |
|
Fieldwork dates: |
April 11 – May 16, 2014 |
|
Sample size: |
1,001 |
|
Margin of error: |
+/-4.5 percentage points |
|
Representative: |
Adult population |
|
|
|
Country: |
Uganda |
|
Sample design: |
Multi-stage cluster sample stratified by region and urbanity |
|
Mode: |
Face-to-face adults 18 plus |
|
Languages: |
Luganda, English, Runyankole/Rukiga, Luo, Runyoro/Rutoro, Ateso, Lugbara |
|
Fieldwork dates: |
April 25 – May 9, 2014 |
|
Sample size: |
1,007 |
|
Margin of error: |
+/-3.9 percentage points |
|
Representative: |
Adult population |
|
|
|
Country: |
Ukraine |
|
Sample design: |
Multi-stage cluster sample stratified by Ukraine’s six regions plus ten of the largest cities – Kyiv (Kiev), Kharkiv, Dnipropetrovsk, Odessa, Donetsk, Zaporizhia, Lviv, Kryvyi Rih, Lugansk, and Mikolayev – as well as three cities on the Crimean peninsula – Simferopol, Sevastopol, and Kerch |
|
Mode: |
Face-to-face adults 18 plus |
|
Languages: |
Russian, Ukrainian |
|
Fieldwork dates: |
April 5 – April 23, 2014 |
|
Sample size: |
1,659 |
|
Margin of error: |
+/-3.3 percentage points |
|
Representative: |
Adult population (Survey includes oversamples of Crimea and of the South, East and Southeast regions. The data were weighted to reflect the actual regional distribution in Ukraine.) |
|
|
|
Country: |
United Kingdom |
|
Sample design: |
Random Digit Dial (RDD) probability sample of landline households, stratified by government office region, and cell phone-only households |
|
Mode: |
Telephone adults 18 plus |
|
Languages: |
English |
|
Fieldwork dates: |
March 17 – April 8, 2014 |
|
Sample size: |
1,000 |
|
Margin of error: |
+/-3.4 percentage points |
|
Representative: |
Telephone households (roughly 98% of all households in the United Kingdom) |
|
|
|
Country: |
United States |
|
Sample design: |
Random Digit Dial (RDD) probability sample of landline and cell phone households |
|
Mode: |
Telephone adults 18 plus |
|
Languages: |
English, Spanish |
|
Fieldwork dates: |
April 22 – May 11, 2014 |
|
Sample size: |
1,002 |
|
Margin of error: |
+/-3.5 percentage points |
|
Representative: |
Telephone households with English or Spanish speakers (roughly 96% of U.S. households) |
|
|
|
Country: |
Venezuela |
|
Sample design: |
Multi-stage cluster sample stratified by states and municipality size |
|
Mode: |
Face-to-face adults 18 plus |
|
Languages: |
Spanish |
|
Fieldwork dates: |
November 8, 2013 – February 12, 2014 |
|
Sample size: |
1,540 |
|
Margin of error: |
+/-3.9 percentage points |
|
Representative: |
Nationally representative of 95% of the adult population (excluding regions of Delta Amacuro, Amazonas and Dependecias Federales, as well as 183 parishes deemed inaccessible based on safety conditions at the time of fieldwork) |
|
Notes: |
The sample for Venezuela includes additional interviews to correct for gender imbalance detected during fieldwork. The original base sample consisted of 1,500 interviews |
|
|
|
Country: |
Vietnam |
|
Sample design: |
Multi-stage cluster sample stratified by region and urbanity |
|
Mode: |
Face-to-face adults 18 plus |
|
Languages: |
Vietnamese |
|
Fieldwork dates: |
April 16 – May 8, 2014 |
|
Sample size: |
1,000 |
|
Margin of error: |
+/-4.5 percentage points |
|
Representative: |
Adult population |
|