[PART THREE] THE PRIESTS AND DEACONS ACCUSED
OF SEXUAL ABUSE |
3.1 INTRODUCTION TO THE PROBLEM OF CHILD SEXUAL ABUSE BY ADULT MEN
For many years, scholars and practitioners have attempted to describe and categorize adult men who engage in sexually abusive behavior with children under the age of 18. One clear finding is that child sexual abusers are a heterogeneous population of individuals. There are sexual offenders in all racial, ethnic, age, and socioeconomic categories. In describing child sexual abuse, researchers in this area have focused on the characteristics of the abusers themselves (e.g., static personal variables, such as sexual attraction preferences, and personality) and variables related to the context in which the abuse occurs (e.g., access to victims, isolation of the offender, and presence of substance abuse) as well as personal and situational characteristics of their victims in an effort to create typologies of abusers for assessment and treatment purposes. [1; notes are collected in a note section at the end of this Web version; after clicking the number to view the note, click Back to return to this point in the text of the report]
One way of categorizing offenders, for example, is by the type of victim they choose. Some child sexual abusers are diagnosed as pedophiles, meaning that they exhibit recurrent, intense, sexually arousing fantasies, urges or behaviors related to sexual contact with a prepubescent child over a period of at least six months duration. [2] However, not all sexual abuse occurs with young children, and not all child sexual abusers fit this clinical diagnosis. Some researchers have identified a similar condition, ephebophilia, which refers to individuals who exhibit these same fantasies, urges or behaviors towards post-pubescent youths. [3] While some offenders evidence a clear preference for particular types of victims with regard to age and gender, many do not. Individuals who molest children may be heterosexual, homosexual, or bisexual with regard to victim selection. Child sexual abusers who prefer female victims are more likely to be diagnosed as pedophiles than those who prefer male children while child sexual abusers who prefer male victims tend to target boys who are slightly older. [4]
A second way of categorizing offenders is based on the factors believed to produce the offending behavior. The most widely accepted classification of child molesters follows a dichotomous model consisting of fixated offenders and regressed offenders. [5] A fixated offender is characterized as having a persistent, continual, and compulsive attraction to children. In contrast, regressed offenders are individuals who are primarily attracted to adults, but who are perceived to engage in sexual activity with children in response to particular stressors (e.g., marital problems and unemployment) or contextual variables (e.g., stress or loneliness). [6] Subsequent research has demonstrated that while these two concepts are still important in terms of describing sexual abusing types, this classification alone is not sufficiently nuanced to describe the complexities of child sexual abusers. [7] Instead, fixation can be understood to exist on a continuum, meaning that all offending behavior is likely to result from some varying degrees of a combination of stable personal characteristics (e.g., substance abuse) with contextual variables (e.g., depression). [8] It is clear that multiple subtypes of offenders exist within [page 37 begins] the population of sex offenders; however, there is no single classification system that has strong empirical support.
Empirical studies on child sexual abuse in the Catholic Church are limited. However, a number of descriptive studies have been reported which have examined small, often clinical samples of clergy. These studies suffer from a number of methodological weaknesses, such as small, non- representative samples, which limit their findings and make it impossible to draw any type of meaningful generalization about child sexual abuse in the Church. This literature, however, has focused attention on a number of important topics to be considered in studying the issues within the Church, including the difference between sexually offending and non-offending priests, [9] the difference between sexually offending priests and sexual offenders in the general population, [10] personality characteristics or backgrounds of sexually offending priests, [11] the link between child sexual abuse and substance abuse, [12] and the emotional or psychological development of abusive priests. [13] The survey instrument completed for each priest against whom allegations of abuse had been made incorporated questions associated with these topics. The followings sections of the report present information about the priests and deacons alleged to have committed child sexual abuse.
[Notes for the previous section are collected in a note section at the end of the Web version of this report, and every reference in the text is hyperlinked to the note itself.]
[notes 1-12 are on page 37, and note 13 is on page 38; then page 39 begins]
3.2 SUMMARY RESULTS: PRIESTS WHO HAVE ALLEGATIONS OF SEXUAL ABUSE
Priests who have allegations of sexual abuse of minors are a heterogeneous group of individuals. This is also the case with the general population of child sexual abusers, who have no consistent pattern of age, socioeconomic status, race or psychological problems. The purpose of this chapter is to explain the characteristics of these priests, including their demographic characteristics (e.g., age at time of ordination and offense), their status in the Church, any behavioral and psychological problems they have experienced and any criminal penalties resulting from the allegations of abuse. The study produced a number of interesting findings:
• The majority of priests with allegations of abuse from 1950-2002 were ordained between the 1950s and 1970s.
• The majority of priests with allegations of abuse are diocesan. Religious priests have slightly more than half as many allegations as diocesan priests. Additionally, religious priests have fewer multiple allegations and fewer allegations of “severe” offenses (e.g., those with penetration).
• Surveys indicated that some priests with allegations of sexual abuse also showed a variety of behavioral problems, the most common of which were personality problems.
• Few incidents were reported to the police. It is possible to speculate that one reason for this is because of the delay in reporting of abuse; consequently, the abuse was alleged beyond the statutes of limitation in many instances.
• When allegations were made to the police, they were almost always investigated,
and about one in three priests were charged with a crime. Overall, few priests
with allegations served criminal sentences; only 3% of all priests with allegations
served prison sentences. The priests with many allegations of abuse were not
more likely than other priests to be charged and serve prison sentences. [page
40 begins]
3.3 DEMOGRAPHIC CHARACTERISTICS OF PRIESTS AND DEACONS ACCUSED OF SEXUAL ABUSE OF YOUTHS UNDER 18
This chapter is based on survey data that describes 4,392 individual men ordained as Catholic priests or deacons. The following steps were taken to achieve that number:
• 4,627 surveys were submitted based on files of individual priests and deacons.
• 68 surveys were removed as ineligible for the study.
• 143 priests were accused of sexual abuse of minors in more than one diocese or religious community. These individuals were identified as having identically encrypted initials and birth dates. All were also confirmed by ordination year and seminary. The information about these men from multiple surveys has been collected into a single entry, and the duplicate entries deleted.
• There were 41 permanent deacons, 20 transitional deacons and 22 seminarians (who were later ordained) among the group of men accused of sexual abuse of minor children. Since there were few deacons, it should be understood that they are included when priests are mentioned.
• Not all questions were answered on each survey; as a result, each table shows the available responses, and the total will change from table to table.
Birth dates of the clerics accused of sexual abuse of minors during the study period span more than a century–from 1867 to 1973 (Table 3.3.1). The ordination dates show a similar range, from 1890 to 2000 (Table 3.3.2). However, the majority of men in this study were born between 1920 and 1950, and were ordained in their mid- to late-twenties. Almost 50% of these men were ordained at ages 26 or 27, and 75% were ordained between the ages of 26 and 30. The majority were ordained after 1950.
Table 3.3.1 Decade of Birth
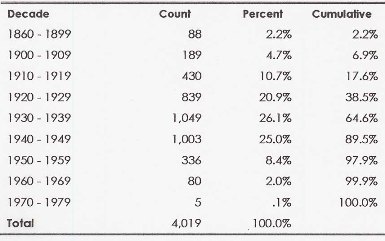 |
The year of a priest or deacon’s birth was provided for 4,019 individuals, or 91.5% of those reported in the surveys. |
Table 3.3.2 Decade of Ordination
 |
The year of ordination was provided for 4,034 priests and deacons, or 91.6% of those reported in the surveys. Canon law establishes the age for ordination. In 1983, Canon Law established the minimum age for ordination as 24. In earlier years, it would have been possible to be ordained to minor orders at a younger age. With respect to those ordained before the mid-1950s, we cannot be sure how those who completed the surveys understood ordination date and whether the date reported is ordination to a minor order or ordination to the priesthood. |
The average age at the time of ordination of those included in this study did not change between 1880 and 1979, but has risen significantly in the last 20 years to 35 in the period between 1990 and 2002. This change in age at time of ordination, observed in this subset of all men ordained to the Catholic priesthood, is consistent with an overall trend in the Catholic Church. If all are considered, the average age at the time of ordination for a diocesan priest in this study is 28 and for a religious priest, 29.
Table 3.3.3 Age at Time of Ordination
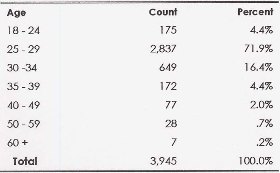 |
The age at ordination was calculated by subtracting the year of birth from the year of ordination. Information on both ages was available for 3,945 priests and deacons. |
Only 1% of the men in this study were married at the time an allegation of sexual abuse was made against them.
Table 3.3.4 Cleric’s Marital Status
 |
The deaconate is the first stage of ordained ministry. Both married and unmarried men may be ordained as permanent deacons. |
The clerical status at the time the allegation was made is shown below in Table 3.3.5. 172 individual priests held more than one status during the period covered by the accusation of abuse. Overall, 69.4 % of the accused priests were diocesan priests and 22.1% were religious priests.
Table 3.3.5 Clerical Status at Time of Allegation
 |
Some priests held more than one clerical position during the period of alleged abuse. Twelve priests held the status of bishop at some point during the period of alleged abuse. Nine bishops who were the subject of allegations held more than one clerical status. Seminarians or brothers who had been the subject of allegations before they were ordained were included in the study as long as they proceeded to ordination. The total of 4,211 shown in Table 3.3.5 is less than the overall total of 4,392 because not all survey forms provided information about clerical status. |
As a whole, the known population of sexual offenders is older than the population of other types of offenders. However, those who have more victims and are more serious offenders tend to have an earlier age of onset. Paraphilias often develop prior to adulthood, and adult sex offenders who had sexual convictions as adolescents generally commit both more offenses and more serious offenses as adults when compared with those who were not juvenile-onset offenders.
Table 3.3.6 Age of Priest at First Instance of Alleged Abuse
 |
Table 3.3.7 Age of Priest at First Instance of Alleged Abuse, Diocesan
& Religious
 |
The average age of a priest at the first incident or allegation of child sexual abuse is 39 if all surveys are considered, and the median is 35. The average and median both rise gradually from late 30s to late 40s between 1950 and 2002.
Table 3.3.8 Change in Age at First Instance of Alleged Abuse, 1950–2002 by Decade
 |
3.4 PRIESTS WITH BEHAVIORAL PROBLEMS
Mental health and treatment professionals have found that it is not uncommon for those who engage in child sexual abuse to demonstrate other behavioral and psychological problems as well. Studies on co-occurrence of sexual offending and other problems have consistently found high rates of personality dysfunction [1] as well as major mental disorders such as anxiety or depression. [2] Similarly, alcohol or substance abuse problems are frequently present among those who engage in child sexual abuse. [3] Studies which have examined clergy who sexually abuse minors with co-occurring problems have found them to exhibit fewer psychological problems than other sex offenders. [4] However, methodological limitations preclude firm conclusions about groups of clergy who offend.
To examine the co-existence of child sexual abuse and other problems, the study instruments inquired about other types of problems that were evident from a priest’s files. The question asked specifically about whether the priest had a history of abuse that was either indicated in the record or known to the diocese; whether he had a history of substance abuse; whether there had been questions raised about his fitness for ministry and whether he had manifested other behavioral problems. Records of 1,400 priests and deacons, nearly one in three of those against whom allegations of sexual abuse of a youth under 18 were made, showed a history of substance abuse, questions about his “fitness for ministry” or behavioral problems.
According to information contained in Church records, very few priests accused of sexual abuse had themselves been victims of abuse. It should be kept in mind, however, that unless a priest self-disclosed his own prior abuse or it had been specifically raised as an issue, there might not have been an indication of abuse in Church files. Of the 4,392 priests and deacons, 279, or 6.8% of the total number, were reported to have been abused (see Table 3.4.1 for breakdown of this number by type of abuse). Of these, a smaller number, 67 reported multiple forms of abuse. Almost half of the priests whose records indicated prior sexual or physical abuse also suffered verbal and emotional abuse.
Table 3.4.1 Priests with a History of Victimization, By Type of Abuse
 |
The files for 68 priests included information indicating that they had experienced more than one form of abuse during childhood. |
When there was a history of childhood abuse, the most frequent abuser was an adult man. As shown in Table 3.4.2, of the 274 priests reported to have been abused themselves, nearly half of them were abused by someone in their family. Thirty-five percent were abused by a parent and 25 percent by a father.
Table 3.4.2 Priests with a History of Victimization, By Type of Abuse [sic, actually by type of abuser]
 |
A total of 48 priests were reported to have been abused by a priest or deacon. This illustrates that 18 percent of priests with allegations of abuse had themselves been abused by a priest or deacon. |
A history of substance abuse was reflected in the files of slightly fewer than one in five of the priests and deacons accused of sexual abuse. Alcohol abuse was reported much more frequently than drug abuse, implicated in 96% of the 753 priests with substance abuse information in their records.
Table 3.4.3 Substance Abuse History
 |
The survey did not ask for a formal diagnosis of substance abuse or dependence. It was deemed sufficient that the personnel file included an indication that the problem of substance abuse had been observed. |
Table 3.4.4 Comparison of Priest Victims
 |
Priests who had themselves been victims of abuse were twice as likely to have a history of difficulties with alcohol, illegal drugs or both. |
For those priests with information about substance abuse problems in their files, nearly 72% were referred for evaluation or treatment, with no action reported for nearly 16% (see Table 3.4.5). However, it should be noted that evaluation and treatment referrals are likely to have been documented in the files whereas less formal handling of substance abuse issues might not have been included in the files, so these numbers need to be interpreted cautiously in terms of efficacy. Of those who were referred for treatment, Table 3.4.6 shows that more than 85% were sent for treatment outside of the diocese (76% of whom were referred for inpatient treatment).
Table 3.4.5 Church Response to Substance Abuse
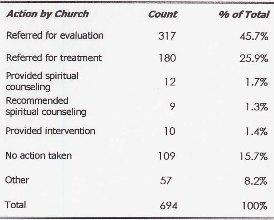 |
Table 3.4.5 shows the initial response undertaken by dioceses and religious communities to care for a priest with a substance abuse problem. In the majority of cases, more than one response was made. According to data from the surveys, 63% of those priests recognized to have a substance abuse problem were referred for treatment. |
Table 3.4.6 Substance Abuse Treatment
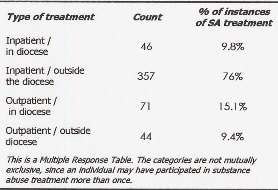 |
Table 3.4.6 includes all instances of treatment reported in the surveys. Forty six priests were treated twice for substance abuse problems and four were treated three times. |
Church records for 476 priests, or 10.9% of the total in the study, raised questions about those priests’ fitness for ministry. Another 774 were identified as having behavioral problems. The handwritten notes documenting these problems indicated they were largely psychological in nature (82.2% of those with noted behavioral or fitness for ministry problems were described as having psychological problems). If fitness and behavioral problems are considered together with other noted problems,1,400 priests and deacons, or 32% of those who were later the subject of an allegation of sexual abuse had been recognized as having behavioral problems.
Table 3.4.7 Classification of Fitness and/or Behavioral Problems
 |
Table 3.4.7 provides a classification of the types of problems that were described in the surveys. Table 3.4.7 includes information about 1,400 priests. |
[Notes for this section are collected in a note section at the end of the Web version of this report, and every reference in the text is hyperlinked to the note itself.]
[notes were on page 50 in the original; then page 51 begins]
3.5 PRIESTS AND DEACONS AND THE ALLEGATIONS
Statistics from recent United States Justice Department studies of the prevalence of youth victimization confirm what other surveys have found: a startling proportion of young people experience sexual victimization[.] [1] In a sample of 4,023 adolescents ages 12 to 17 across racial and ethnic groups, the lifetime prevalence for sexual assault is 8.1%[.] [2]
Of all female victims of forcible rape whose ages were reported to enforcement agencies in 1992 (from 15 states), girls under the age of 18 represented approximately half of the victims. [3] The younger the victim, the more likely that she knew the person who assaulted her. [4]
When similar research was done with data on all victims of sexual assault known to law enforcement between 1991 and 1996, juveniles represented the large majority of all victims of forcible fondling (84%), forcible sodomy (79%), and sexual assault with an object (75%)[.] [5] One in seven victims of a reported sexual assault was under the age of six. [6] The single age with the greatest proportion of sexual assault victims among all victims reported to law enforcement was age 14. [7]
Table 3.5.1 Allegations against Priest / Deacons, Grouped by Number of Allegations
 |
The Cleric Survey asked for the total number of victims who made allegations in the reporting diocese and for the total number off potential allegations that might be made about a particular priest or deacon. Respondents were also asked to complete a Victim Survey for each person making an allegation. Table 3.5.1 is based on the data from the Cleric Survey. |
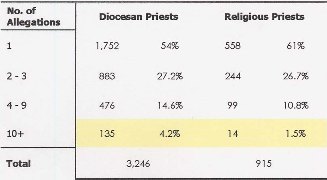
If accused diocesan and religious priests are compared using the above classification
into four groups, the results do not differ greatly
• 54% of diocesan priests had a single allegation compared to 61% of accused
religious priests;
• 14.7 of diocesan priests have 4-9 allegations, compared to 10.9% of the accused
religious priests;
• 4.2% of diocesan priests have ten or more allegations, compared to 1.5% of
the religious priests.
Question 23 on the Cleric Survey asked the respondent to report the number of victims who had made formal allegations known to the diocese and religious community about an individual priest. These allegations are referred to in Table 3.5.2 as “Formal Allegations.” The following survey question asked “Is there any indication that the cleric has abused more victims than the official allegations made?” The affirmative responses, and the numbers associated with them, are referred to as “Potential Allegations.”
Table 3.5.2 Formal and Potential Allegations against Priests, in Four Groups
 |
If the formal allegations made against an individual priest or deacon are added to the potential allegations known to the diocese or religious community, the result is shown in Table 3.5.2. |
Table 3.5.3 Gender of Alleged Victims, By Number of Alleged Abusers
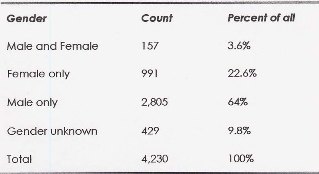 |
Table 3.5.3 shows the percentage of all priests with allegations, grouped by the gender of the person who made the allegation. In 429 surveys, the gender of the alleged victim was not identified. |
Table 3.5.4 Alleged Victims of Sexual Abuse Incidents, Grouped by Gender and Age
 |
The data for Table 3.5.4 are drawn from the Cleric Surveys. The question on that survey that asked for a listing of alleged victims’ ages and gender was not completed for all surveys. Therefore the totals in Table 3.5.4, when summed, are not the same as the total number of alleged incidents.
Figure 3.5.1 Gender Ratio of Alleged Victims, By Decade of Accusation
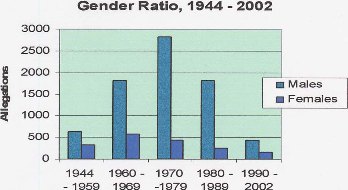 |
The year 1944 appears in this figure because one incident of abuse began in 1944, along with others that began in the late 1940s, but continued after 1950. The years of abuse before 1950 are not counted when the totals by year are derived, but are included here.
Table 3.5.5 Alleged Male Victims, Age at First Instance of Abuse by Decade
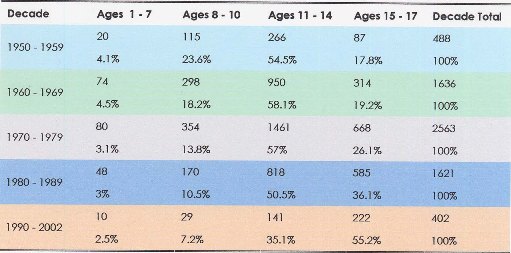 |
Table 3.5.6 Alleged Female Victims, Age at First Instance of Abuse, By Decade
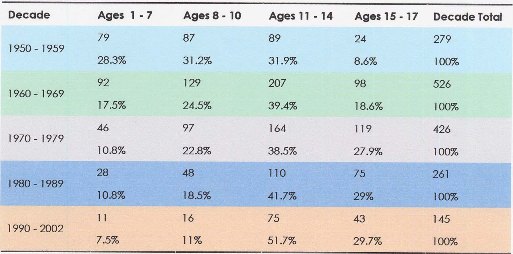 |
The information in Tables 3.5.5 and 3.5.6 is taken from the Victim Surveys and available only for those surveys that included answers to the three questions about gender, date of incident and age at the time of the incident. Complete responses were received for 82%, or slightly more than four out of five, of the incident-level surveys.
Table 3.5.7 Summary of Alleged Acts of Sexual Abuse
 |
[Notes for the previous section are collected in a note section at the end of the Web version of this report, and every reference in the text is hyperlinked to the note itself.]
3.6 SERIAL ABUSERS: PRIESTS WITH MULTIPLE ALLEGATIONS
Many individuals who commit a sexual offense, such as child sexual abuse, do so as a result of situational or impulsive factors. These are often single-victim offenders who may never repeat their crime or may repeat the act only if the same or similar circumstances recur. For example, such individuals may only act out when their controls are reduced due to intoxication, when experiencing significant situational stress, or when an opportunity is present. Thus, their behavior is often unplanned and considered a "regression," triggered largely—but not entirely—by external conditions.
However, there is a much smaller number of serial sex offenders who act out not as a result of the effects of external stress or a weakening of inhibitory controls; instead, they behave in a more methodical fashion using a high degree of planning. In these cases, there is a strong compulsion to act-—a compulsion derived from a fixation on the type of victim desired and the type of acts performed. These offenses are often preceded by years of intense fantasy in which the act is rehearsed and strategies are developed. Offenders of this type have a very high potential to repeat their crimes. Such individuals can be quite manipulative in the way they approach victims and in the methods they employ to avoid apprehension. Because their crimes are highly planned and often target particular types of victims, they may abuse large numbers of children before they are apprehended.
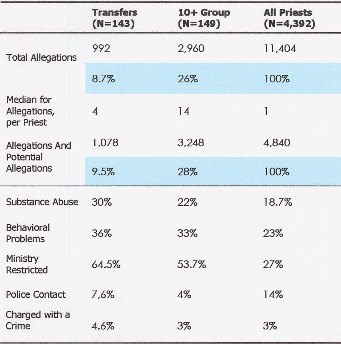
Those priests who have been accused of abusing a large number of young people have attracted significant, often sensationalized, nationwide attention. These cases are frequently discussed along with the cases of those priests who have been transferred from diocese to diocese and who have continued to be accused of sexual abuse of youth under 18. Data from this study has found these two groups to be different in many aspects. Those priests who have ten or more allegations differ in many respects from the average for all priests in the study, but this is not as true for the group having allegations in more than one diocese or religious community. The study received 149 surveys for priests who had ten or more allegations of child sexual abuse—although if potential allegations (from potential victims known to the diocese) are included, the number of priests is 252. After careful analysis, 143 priests out of the total number of 4,392, were identified as having been the subject of allegations in more than one diocese. Of that group, nine had allegation made in three dioceses and one priest was accused of sexual abuse in four dioceses.
• The group of 149 priests, the “10+ group,” account for 26% of all incidents reported in the study. The 143 priests who were accused in more than one diocese, the “Transfers,” had a lower rate of accusation, but account for 8.7% of all incidents reported in the study (see Table 3.6.1).
• The group of 143 priests who received accusations in at least two dioceses or religious communities were more likely to be identified with substance abuse and behavioral problems and more likely to be reported to the police. Overall, 64% of the “Transfer” group saw their ministry restricted.
Table 3.6.1 Priests with Multiple Allegations: Comparison of Two Groups
 |
These data are taken from the Cleric Survey. The total number of allegations reported there exceeds the number of Victim Surveys received. The Cleric Survey asked for the total number of allegations that had been made against a priest or deacon in the responding diocese or religious community. It also asked for the number of other incidents not yet reported that were associated with or suspected of a particular priest. |
The distribution of the number of allegations per priests is similar for diocesan and religious priests except with respect to 10+ group. There are only 14 religious priests in the 10+ group of 149.
Table 3.6.2 Serial Abusers by Clerical Status
 |
3.7 CRIMINAL PROSECUTIONS AND PENALTIES
Despite the gravity of the crime of child sexual abuse and the public policy interest in dealing effectively with it, very little systematic data has been collected that would provide a clear profile of those who are prosecuted, convicted or incarcerated for child sexual abuse. [1] As a U.S. Department of Justice publication explains, despite a few highly publicized cases of sexual assaults of young children, “there is little empirically-based information on these crimes.” [2] The National Crime Victimization Survey, for example, collects data on victims over the age of 12. There is reason to believe, however, that sexual assault crimes against juvenile victims comprise a large proportion of sexual assaults handled by law enforcement agencies. [3]
In the last ten years or so, a new reporting system has been in place, the National Incident-Based Reporting Systems (NIBRS), which has the potential to provide much more detailed information about those who are arrested for sexual assaults against children and the methods of arrest clearance. [4] However, it is limited in representativeness because law enforcement agencies are not mandated to participate; for example, data from a July 2000 report draws from only 12 states. [5] Nevertheless, it does provide relevant contextual information. It reports that, in general, sexual assaults of juvenile victims were more likely to result in an arrest (29%) than were adult victimizations (22%) although rates were lower for victims under 6 (19%) versus approximately 32.5% for victims ages 6 to 17. [6] Overall, these results indicate that juvenile victims of sexual assault who were reported to law enforcement agencies were more likely to be male (18%) than were adult victims (4%); nearly one-fourth of the victims under 12 were male. Sexual assaults of children under the age of 6 were “the least likely of all such crimes to result in arrest or be otherwise cleared.” [7] Law enforcement was able to identify the offender in just a third of the sexual assaults of children under age 6 and 45% of those for victims between 6 and 11. [8]
The following tables summarize whether each particular incident or allegation of abuse against a priest led to follow-up in the criminal justice system. Of course, the range of behaviors described in the allegations varied substantially (see Table 4.4.1), which might have affected whether law enforcement contact was initiated or resulted in any follow-up. Overall, fifteen percent of priests were reported to the police by a victim. A much smaller number were reported by a diocese or religious community.
A report to the police resulted in an investigation in almost all cases (see Tables 3.7.1 and 3.7.2). Only 384 of the 4,392 priests and deacons were criminally charged (see Table 3.6.3). The comparative percentages for diocesan, religious and extern priests investigated by the police and subsequently charged are generally equivalent.
Table 3.7.1 Abuse Reported to the Police, By Clerical Status
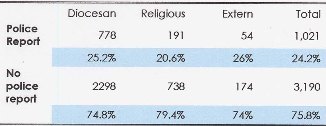 |
According to the information in the Church’s files, approximately 24% of priests accused of abuse were reported to the police, and some were independently detected. |
Table 3.7.2 Abuse Investigated by Police
 |
Tables 3.7.1 – 3.7.4 report information on 4,211 priests and deacons, the total number for whom data was available on both clerical status and police contact. |
Table 3.7.3 Priest Charged with a Crime
 |
Overall, 9.1% percent of priests were charged with a criminal offense (see Table 3.7.3). Although this is 41% of those cases in which a police investigation was carried out, the percentage of charges that proceeded to adjudication would be smaller.
Of the 384 priests who were charged with a crime, a majority (252) were convicted.
Table 3.7.4 Priests Convicted of a Crime
 |
Table 3.7.4 is based on a total number of 4,211 priests. |
Of those who were convicted (priests), the following table summarizes the type of sentence the priest was given for the offense. Criminal penalties are specific to localities or jurisdictions, and the charges against the priests varied widely.
Table 3.7.5 Criminal Penalties
 |
Three men were sentenced to spend the rest of their lives in prison, and two others were required to register as sex offenders. |
Table 3.7.6 Priests, By Number of Incidents Charged
 |
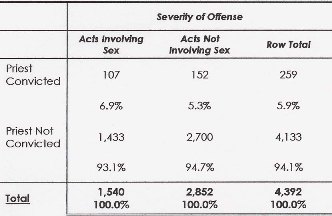
In trying to better understand the types of incidents that led to criminal justice system involvement, the allegations made against priests have been divided into two categories: those involving direct sexual contact either by mouth to genitals (e.g., oral sex, penetration or masturbation) and those without such direct sexual contact (e.g., hugging, kissing or sex talk). The type of incident did not seem to influence whether the alleged victim contacted the police or whether the priest was ultimately charged or convicted (see Tables 3.7.7, 3.7.8 and 3.7.9).
Table 3.7.7 Police Report by Severity of Allegation
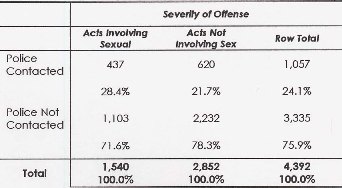 |
Tables 3.7.7 – 3.7.9 show the comparative criminal justice system contact for priests accused of acts or attempts involving penetration or oral sex and those involving an act of masturbation. All other incidents, including those with allegations of unspecified “ sex abuse” or “other” abusive behavior are counted in these tables as not involving sex. |
Table 3.7.8 Criminal Charge by Severity of Allegation
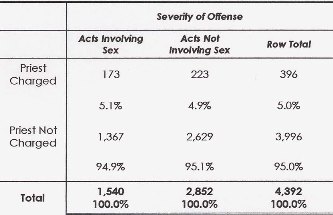 |
Table 3.7.9 Criminal Conviction by Severity of Allegation
 |
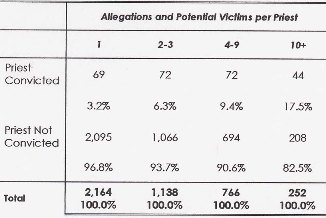
If the accused priests are grouped not just by the number of formal allegations, but by the number of actual and potential allegations (to include the number of potential victims) the results show that investigation, arrest, and conviction are more likely for priests with more allegations.
Table 3.7.10 Police Investigation – Allegations Plus Potential Victims
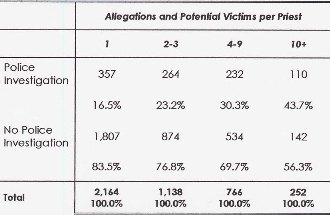 |
The term “potential victims” refers to Question 24 on the Cleric Survey, which asks for any third-party allegations noted in the records. Tables 3.7.10 - 3.7.2 include both actual and “potential” allegations. |
Table 3.7.11 Priest Charged – Allegations and Potential Victims
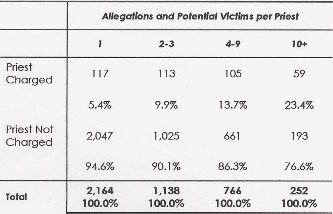 |
Table 3.7.12 Priest Convicted – Allegations Plus Potential Victims
 |
[Notes for the previous section are collected in a note section at the end of the Web version of this report, and every reference in the text is hyperlinked to the note itself.]
[Continue to Part Four or return to Table of Contents.]